Kendall’s correlation coefficient is the best alternative to Spearman correlation (non-parametric) when your sample size is small and has many tied ranks. Other types of correlation coefficients use the observations as the basis of the correlation, Kendall’s correlation coefficient uses pairs of observations and determines the strength of association based on the patter on concordance and discordance between the pairs:
-
Concordant. Ordered in the same way (consistency). A pair of observations is considered concordant if (x2 — x1) and (y2 — y1) have the same sign.
-
Discordant. Ordered differently (inconsistency). A pair of observations is considered discordant if (x2 — x1) and (y2 — y1) have opposite signs.
Two assumptions need to be checked to ensure that valid results are obtained from Kendall’s correlation:
-
The variables are measured on an ordinal or continuous scale.
-
Desirable if your data appears to follow a monotonic relationship.
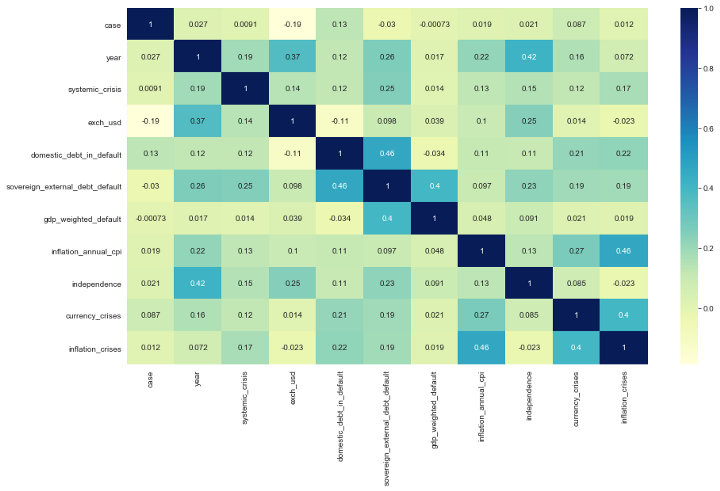
The following code is a simple snipped to create a Kendall’s correlation heatmap for all the features in the dataset and later represent it as a heatmap:
# Import seaborn and matplotlib library to plot the correlation heatmap
import matplotlib.pyplot as plt
import seaborn as sns

# Plot a heatmap of Kendall's correlation for all the features in the dataset
sns.heatmap(df.corr(method="kendall"));
plt.show()