Pearson’s correlation coefficient is a measure of the strength of a linear association between two variables and is denoted by r. Basically, a Pearson’s correlation attempts to draw a line of best fit through two variables’ data. The Pearson correlation coefficient, r, indicates how far away all these data points are to this line of best fit. Pearson’s correlation properties:
- The range of r is between [-1,1].
- The computation of r is independent of the change of origin and scale of measurement.
- r = 1 (perfectly positive correlation), r =-1 (perfectly negative correction) r = 0 (no correlation)
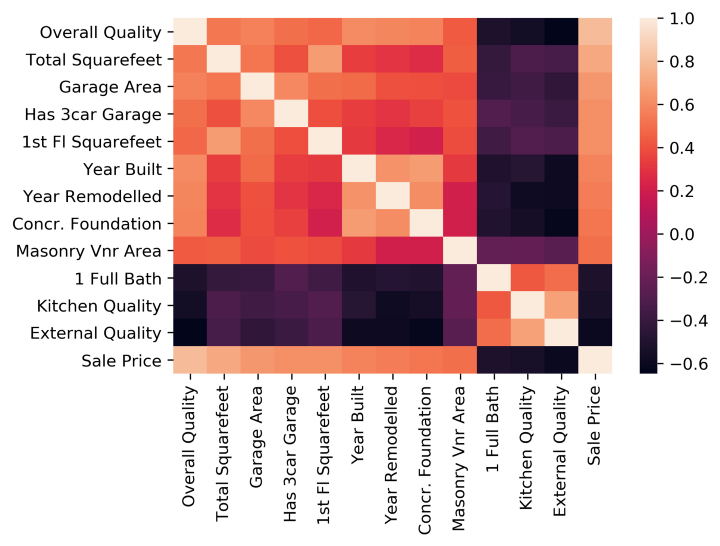
The following code is a simple snipped to create a Pearson’s correlation heatmap for all the features in the dataset and later represent it as a heatmap:
# Import seaborn and matplotlib library to plot the correlation heatmap
import matplotlib.pyplot as plt
import seaborn as sns

# Plot a heatmap of Pearson's correlation for all the features in the dataset
sns.heatmap(df.corr(method="pearson"));
plt.show()