The variables do not always correlate linearly. Unlike Pearson’s approach, Spearman’s rank correlation measures the strength and direction of the association between two variables. It basically gives the measure of monotonicity of the relation between two variables or, in other words, how well the relationship between two variables could be represented using a monotonic function.
A monotonic function is one that either never increases or never decreases as its independent variables changes:
-
Monotonically increasing. As the variable X increases, the variable Y never decreases.
-
Monotonically Decreasing. As the variable X increases, the variable Y never increases.
-
Not Monotonic. As the X variable increases, the Y variable sometimes decreases and sometimes increases.
Spearman’s correlation determines the monotonic relationship’s strength and direction between two variables rather than the strength and direction of the linear relationship between your two variables, which is what Pearson’s correlation determines. Spearman’s correlation properties:
-
The range of r is between [-1,1].
-
Preserves all properties of r.
-
As this is based on ordinal data, it doesn’t depend on any specific distribution.
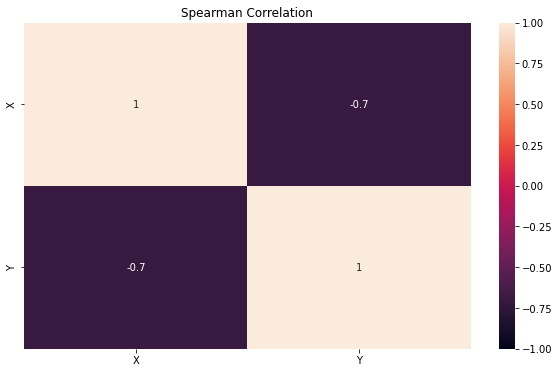
The following code is a simple snipped to create a Spearman’s correlation heatmap for all the features in the dataset and later represent it as a heatmap:
# Import seaborn and matplotlib library to plot the correlation heatmap
import matplotlib.pyplot as plt
import seaborn as sns

# Plot a heatmap of Spearman's correlation for all the features in the dataset
sns.heatmap(df.corr(method="spearman"));
plt.show()