
Define the problem & Gather the data
Pulmonary fibrosis is a disease that causes irreversible damage to the lung. The mean life expectancy of patients is 3.8 years, but prompt diagnosis and early treatment can increase life expectancy up to 5 years. The goal of this project is to explore the personalized evolution of patients using machine learning techniques.
The goal has been defined and therefore we move to the second step of the data science framework: gathering the data. Luckily, the Open Source Image Consortium (OSIC) and the webpage Kaggle recently held a competition to work with pulmonary fibrosis patients. The dataset contains data from 176 unique patients with multiple speriometers per patient. Speriometers provide a variety of lung parameters that can be used to track the progression of pulmonary fibrosis. The Forced Vital Capacity (FVC) is a parameter obtained from the spirometry that represents the proportion of a person’s vital capacity that they are able to expire in the first second of forced expiration to the full. The work of Paternity et al. states there is an augmented risk of death for patients with an FVC reduction (>10%) during a twelve week period. Therefore, following Paternity’s work and using OSIC’s data we will explore FVC predictions of pulmonar fibrosis patients in a twelve week period using machine learning techniques.

Explore the data (EDA)
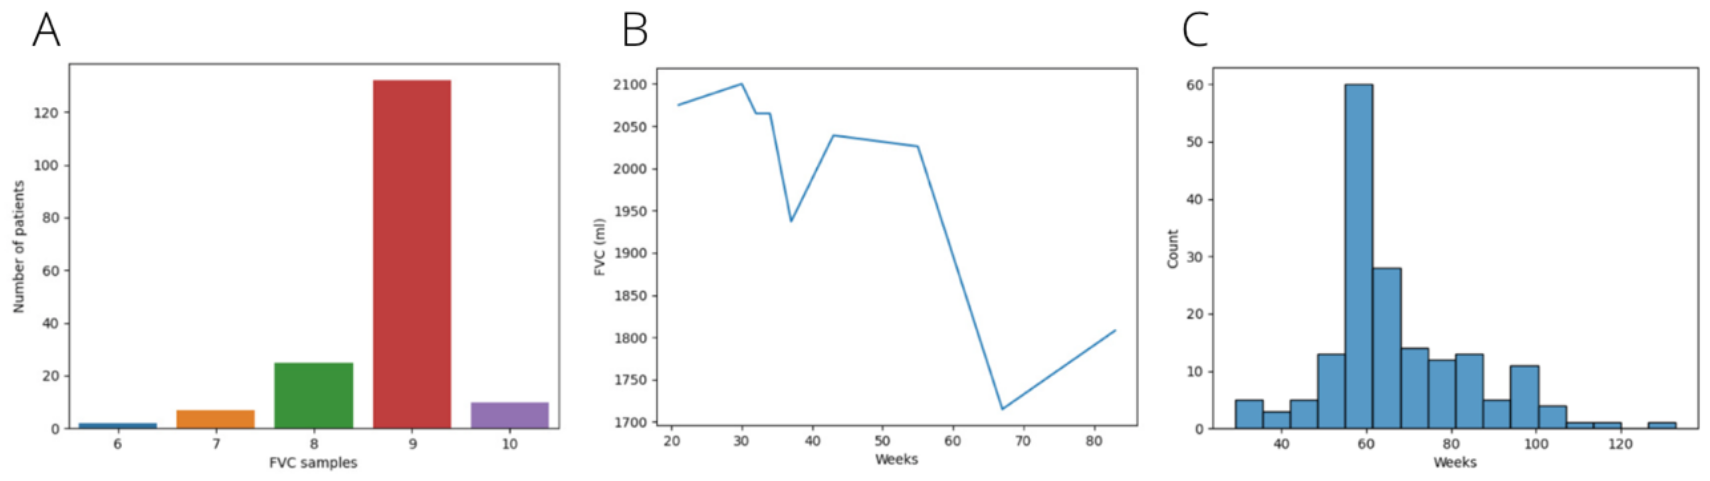
Exploration is crucial to understand the data we are facing and how it can be adapted to be used in our project. As we have previously said, the dataset contains several spirometries for each of the 176 unique patients. The number of spirometries per patient is variable (ranging from six to ten) and separation among them is also irregular. Each spirometry is tagged with a number indicating the week it was performed. Week number zero is considered the week where the patient was diagnosed.
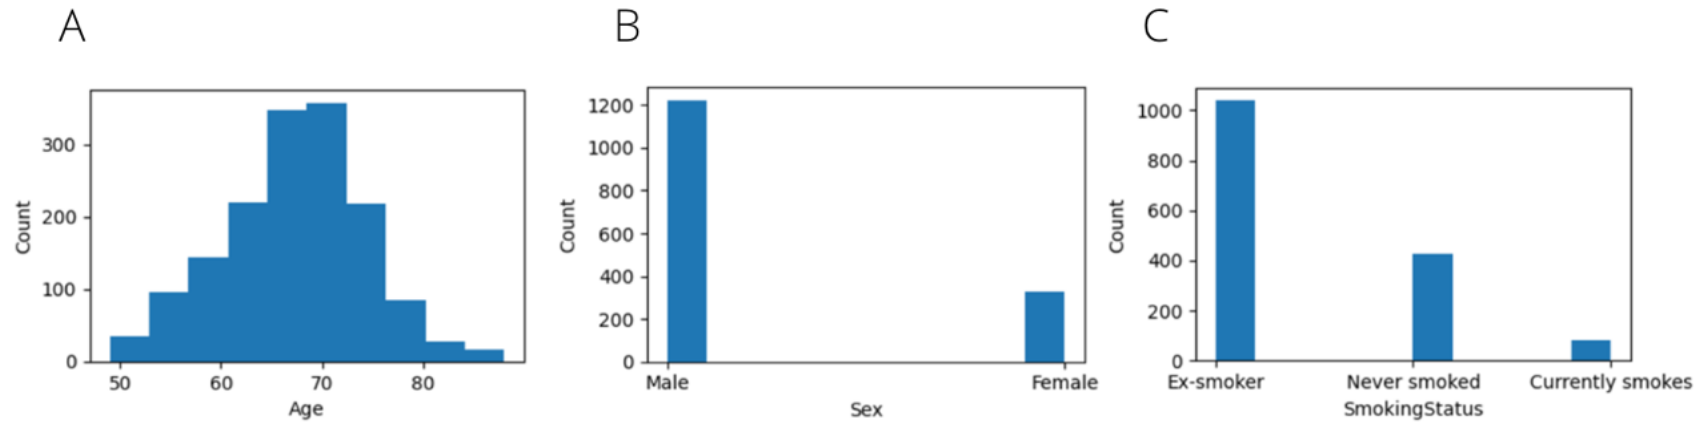
The patient’s age on the dataset range from 50 to 90 years with a mean of 70 and male patients are four times more common than females.
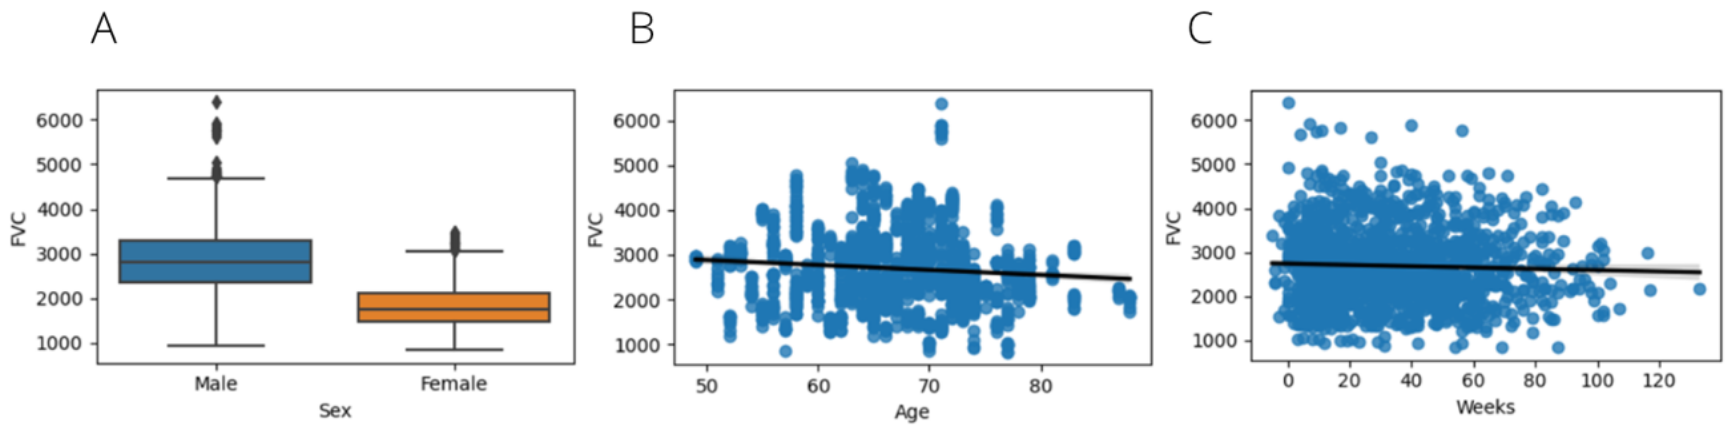
At last, we are going to check FVC over diferent parameters. The mean FVC on men is higher than on women and it decreases for older patients.
Prepare data for consumption
176 patients will be used for training (90%) and 17 for the final evaluation (10%). The number of spirometry samples elapsed 12 weeks in the training dataset is 280. To increase this number we will resample the time series of each patient using the mean value among their spirometries. After the resample the number of spirometries elapsed 12 weeks in the training dataset is 5.854 (we have increased the number of samples 20x).
Model and validate the data
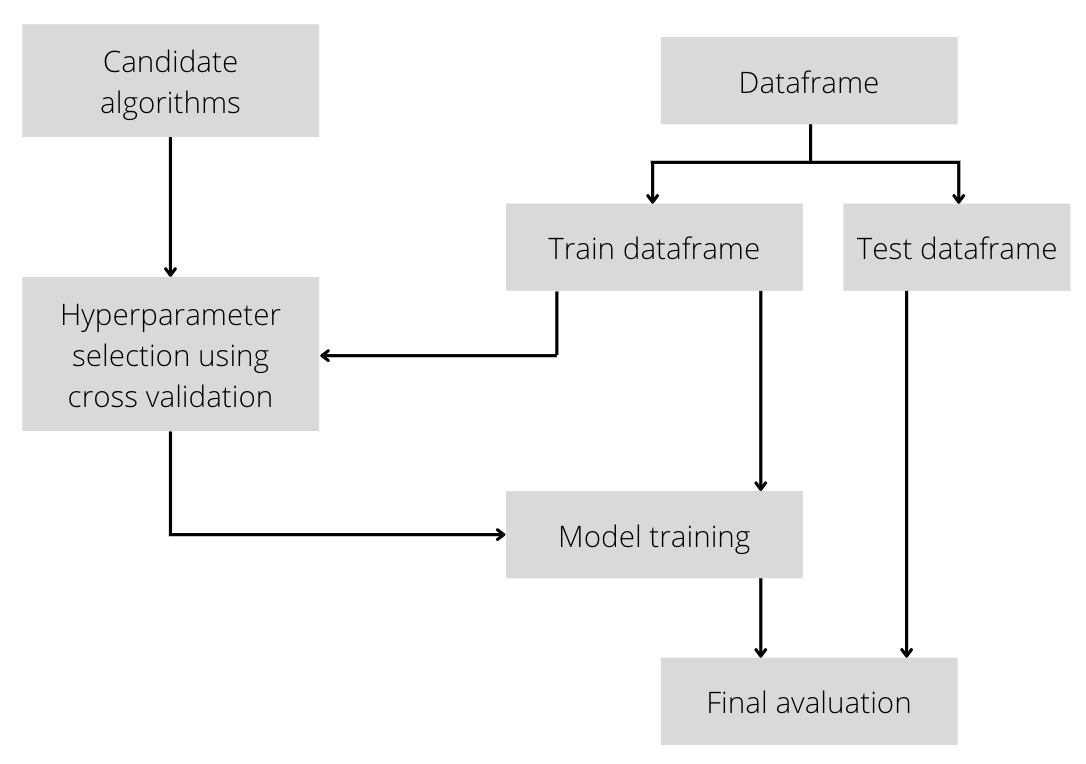
The methodology proposed to solve this problem will tune the hyperparameters on candidate machine learning algorithms and later evaluate each one.
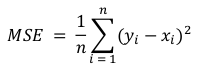
The goal is to predict FVC after a period of 12 weeks for a patient and the regression metric chosen is RMSE to penalise large errors.
And the candidate algorithms will be Support Vector Regressor, Decidision Trees (simple), XGboost and LightGBM (boosting and ensamble of decision trees). It is expected to obtain far better results with XGboost than decision trees, we’ll see!
- Support vector regressor hyperparameters tested: kernel, epsilon, C and Gamma.
- Decision Tree hyperparameters tested: criterion and max depth.
- XGBoost hyperparameters tested: booster, eta, gamma and max depth.
- LightGBM hyperparameters tested: learning rate, iterations, boosting, max depth and number of leafs.
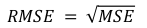
The hyperparameter tuning with cross-validation (k=5) shows the best result for support vector regressor both for mean and deviation.
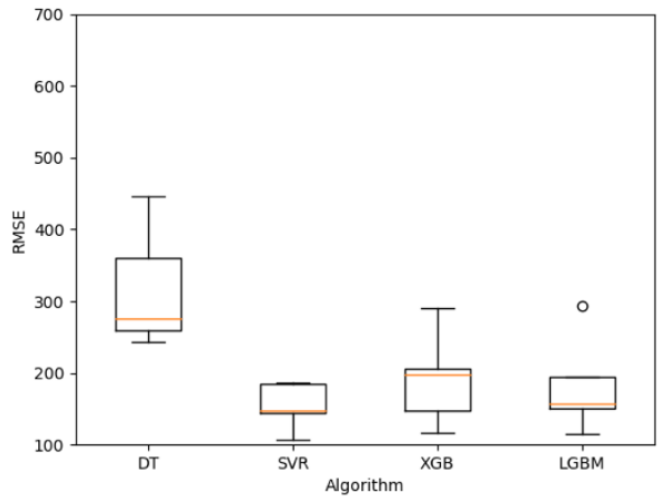
Final evaluation
For the final evaluation we create one model for each algorithm tested trained with the whole training set and with the hyperparameters tunned. Each model is tested against the testing set with the following results.
Conclusion
The results obtained are consistent with what we expected as XGBoost, LightGBM and SVR obtain a far better result than Decision Trees. This is just the start of the project and to obtain better results we should contact the OSIC and gather more data to work with a bigger dataset and find more parameters to be used in the training phase.
The whole code is availabe as a google colab! If you have any questions feel free to email me or send me a msg via linkedin!